Chart Block – Visualize Data with Bar, Line, Pie Charts

Chart Block – Visualize Data with Bar, Line, Pie Charts
Description
This plugin can represent tabular numeric data, functions or some kinds of quality structure and provides different info.
Features
- Fully Customizable: All the options you need to arrange the showcase to your liking are available here.
- Different Types: Chart block comes with different types, you can easily switch the type of chart.
How to use
- First, install the Chart Block plugin
- Add the Chart Block from the block category called “Widgets” in the Gutenberg editor.
- You can change block settings from the right-side settings sidebar.
-
Enjoy!
-
For Installation help click on Installation Tab
Feedback
- Did you like this plugin? Dislike it? Do you have a feature request? Please share your feedback with us
Check out the Parent Plugin of this plugin-
B Blocks – A blocks collection and page building tool for Gutenberg.
Check out our other WordPress Plugins-
Html5 Video Player – Display videos as single and playlist in multiple skins.
PDF Poster – Display/Embed PDF files with different styles.
Html5 Audio Player – Listen audios with awesome visuals.
StreamCast – Customizable radio player with different skins.
3D Viewer – Embed 3D models and 3D products with interaction.
Advanced Post Block – Show posts and custom posts in different layouts.
Installation
From Gutenberg Editor:
- Go to the WordPress Block/Gutenberg Editor
- Search For Chart Block
- Click on the Chart Block to add the block
Download & Upload:
- Download the Chart Block plugin (.zip file)
- In your admin area, go to the Plugins menu and click on Add New
- Click on Upload Plugin and choose the
chart-block.zipfile and click on Install Now - Activate the plugin and Enjoy!
Manually:
- Download and upload the Chart Block plugin to the
/wp-content/plugins/directory - Activate the plugin through the Plugins menu in WordPress
Screenshots
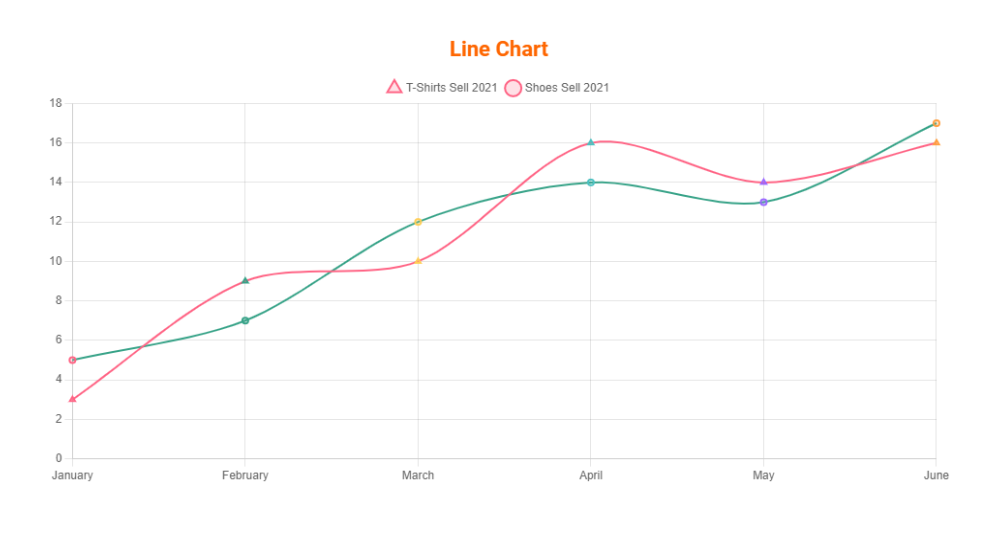
Line Chart
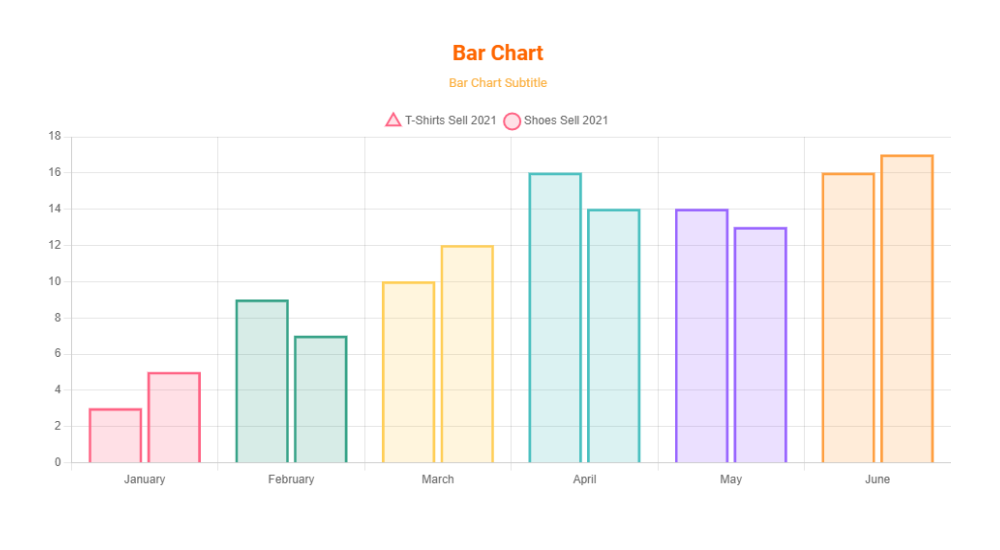
Bar Chart with Subtitle

Pie Chart with Text, Background and Grid line color
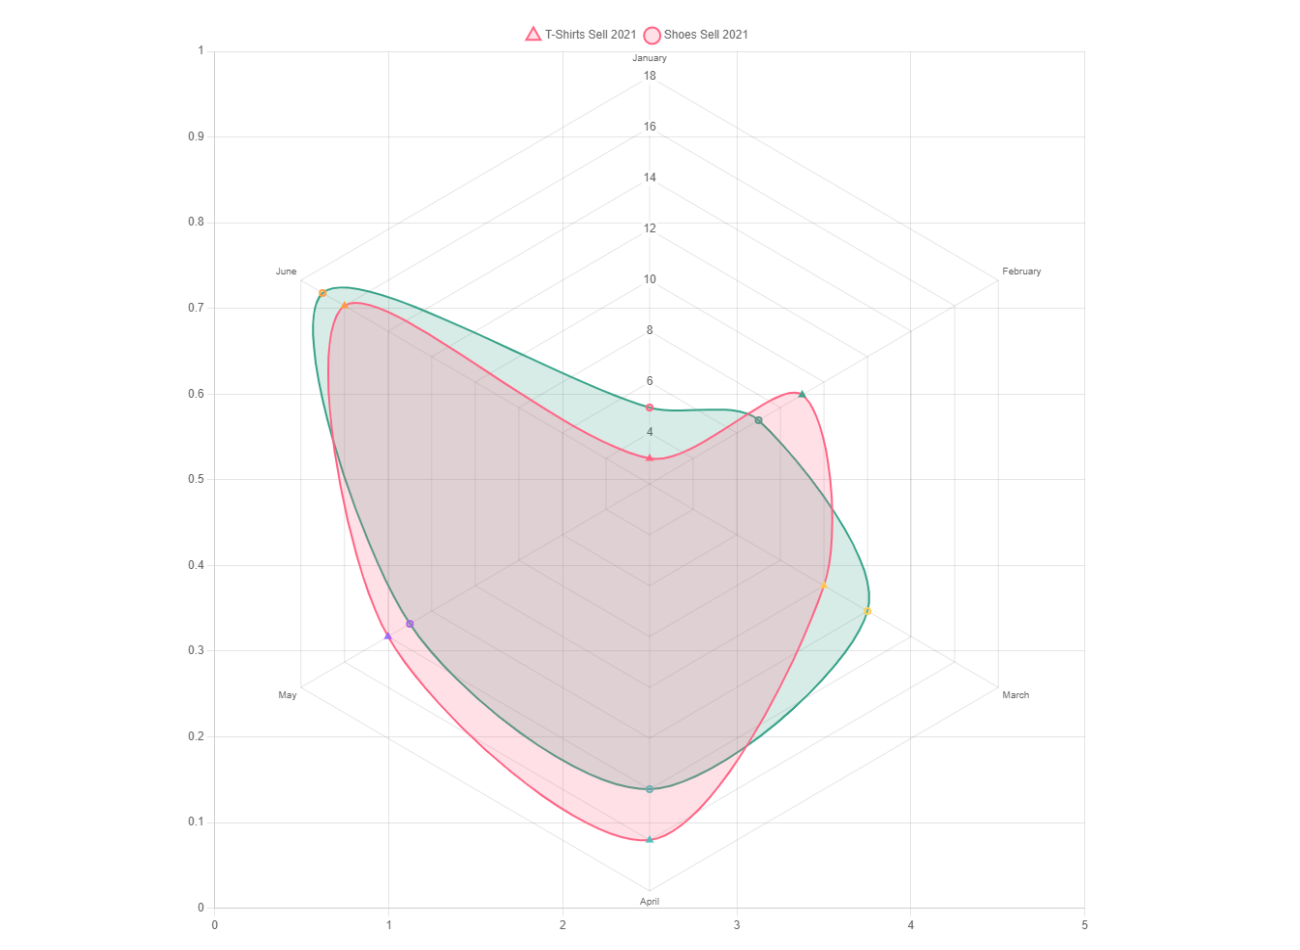
Rader Chart without Title
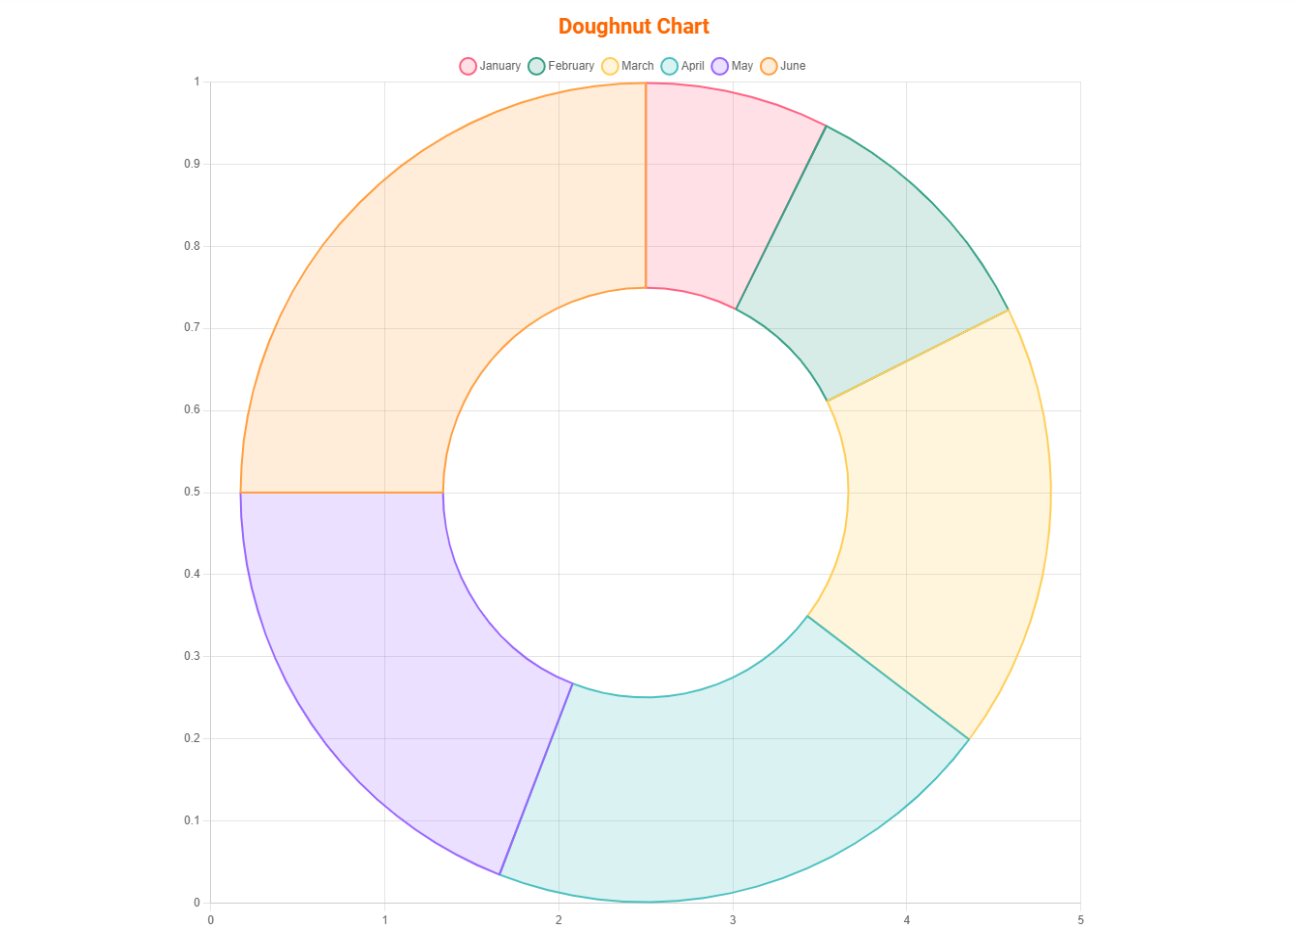
Doughnut Chart
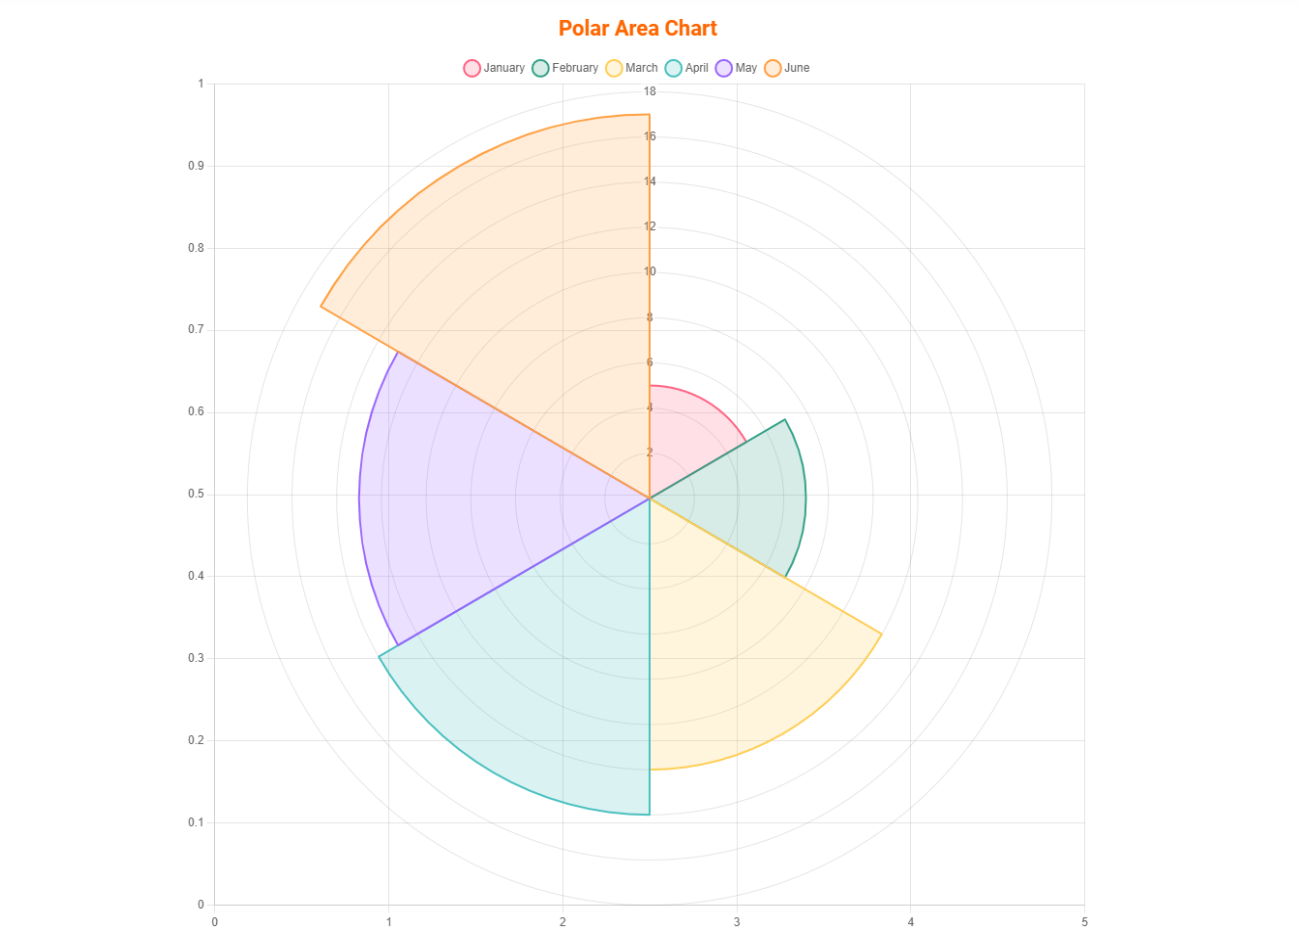
Polar Area Chart
Faq
Yes, Chart Block is a free Gutenberg block plugin.
Yes, it will work with any standard WordPress theme.
Yes, you can change block settings from the Gutenberg block editor’s right sidebar.
You can use unlimited times as you want.
You can post your questions on the support forum here
Reviews
Very useful
By Matej Podstrelenec (matejpodstrelenec) on November 16, 2025
Great plugin that does exactly what is supposed to. No spam, just pure functionality.
Spot on
By wigglypoppins on October 26, 2023
Really great plugin and does almost everything I need it to out of the box, thanks!
It would be good if you had more control over your dataset keys to change font size or have them appear on the respective data point permanently (like they do on hover)
Also a possible addition to your chart types could be a demographic display with 100 people icons and highlighting a percentage of them relative to your data
Muy buen plugin
By luisglave on July 21, 2023
Cumple con todas mis necesidades de publicar gráficos en mi sitio web
Good Value and well designed UI
By tzah on April 21, 2023
I was searching for plugin with an option to change the colors and styles of the graphs. This plugin is so far is the best one I have tested.
It works well and I hope more features will be added to improve the product.
Works well, but could be smarter
By Ben Byrne (drywallbmb) on July 20, 2022
Neat!
By Rajesh (udayrajesh) on June 17, 2022
Generally speaking, he gets the job done!
By maportugal on April 20, 2022
Nice
By zaphodbeeblebrox01 on November 1, 2021
Freaking Awesome.
By nick6352683 on October 17, 2021
Changelog
1.1.6
- Fix Border Issue
1.1.5
- Performance Improvement
1.1.4
- Add translate feature
1.1.3
- Reduce PHP Code
- Performance Improvement
1.1.2
- Add option for height
1.1.1
- Reduce PHP Code
1.1.0
- Add option for show hide X or Y scales
1.0.5
- Add option for showing hide grid lines
1.0.4
- Add the download option for the chart
1.0.3
- Performance upgrade
1.0.2
- Update theme and Colors
1.0.1
- Add an option to change the point size.
- Fix border size when hovering.
1.0.0
- Initial Release.