Glimpse BI

Glimpse BI
Description
Glimpse BI turns your WordPress database into a self-serve BI surface. Build charts and dashboards directly inside wp-admin against your own posts, users, WooCommerce orders, KiviCare appointments, or any other table — without exporting data to a third party.
Every dashboard tile reads through a stale-while-revalidate cache, so multiple admins viewing the same dashboard share one query roundtrip per TTL window. SQL-mode charts pass through an AST-level validator (read-only SELECT/WITH ... SELECT only) before execution, so power users can write hand-tuned queries without giving up safety.
Features:
- No-code chart builder (GUI mode) — pick a table, measure, dimensions, and filters
- SQL mode for hand-written queries — validated server-side, read-only, parameterized
- React-based dashboard grid with 12-column responsive layout (react-grid-layout)
- Runtime parameters per chart (search boxes, date ranges, dropdowns) backed by
wpdb->prepare - Public embed iframes with token auth, rate limiting, and CSV / JSON export
- Built-in dashboard presets — install ready-made dashboards for plugins like KiviCare in one click
- ApexCharts visualizations with a shared design-token theme (KPI, line, bar, pie, table, heatmap, funnel)
- CSV / JSON exports per chart and per dashboard
- Schema introspection with a 1-hour cache and manual refresh
Designed to be polite to your database: query timeouts, row limits (configurable, default 10K), regen-stampede locks, and persistent-object-cache support (auto-detected — uses wp_cache_* when available, transients otherwise).
Source code and build tools
The JavaScript and CSS in assets/build/ are compiled. Their complete, human-readable source ships inside this plugin:
src/— the TypeScript/React source. Each bundle is built from an entry file insrc/entries/:assets/build/admin/frombuilder.tsx,dashboard.tsx,library.tsx,settings.tsxandhost.tsx;assets/build/embed/fromembed.tsxandembed-dashboard.tsx.package.jsonandpackage-lock.json— every JavaScript dependency and its exact version.vite.config.admin.ts,vite.config.embed.ts,postcss.config.js,postcss-glimpsebi-scope.jsandtsconfig.json— the build configuration.
To rebuild the bundles, run these commands in the plugin folder (Node.js 20.19+ or 22.12+):
npm ci
npm run build
The compiled bundles also include these open-source libraries, installed from npm. Their source code is available at:
- React and React DOM — https://github.com/facebook/react
- ApexCharts — https://github.com/apexcharts/apexcharts.js
- react-apexcharts — https://github.com/apexcharts/react-apexcharts
- react-grid-layout — https://github.com/react-grid-layout/react-grid-layout
- CodeMirror — https://github.com/codemirror/dev
- @uiw/react-codemirror — https://github.com/uiwjs/react-codemirror
- Radix UI primitives — https://github.com/radix-ui/primitives
- cmdk — https://github.com/pacocoursey/cmdk
- Lucide icons — https://github.com/lucide-icons/lucide
- next-themes — https://github.com/pacocoursey/next-themes
- Sonner — https://github.com/emilkowalski/sonner
- clsx — https://github.com/lukeed/clsx
- tailwind-merge — https://github.com/dcastil/tailwind-merge
- class-variance-authority — https://github.com/joe-bell/cva
- Tailwind CSS (build tool) — https://github.com/tailwindlabs/tailwindcss
- Vite (build tool) — https://github.com/vitejs/vite
The PHP libraries in vendor/ ship as unmodified source: PHP-SQL-Parser (https://github.com/greenlion/PHP-SQL-Parser) and Vite for WP (https://github.com/kucrut/vite-for-wp). composer.json lists them.
Installation
- Upload the plugin zip via Plugins Add New Upload Plugin, or unzip into
wp-content/plugins/. - Activate “Glimpse BI” from the Plugins screen.
- Visit Glimpse BI Charts to build your first chart, or install a ready-made dashboard from the Presets section at the top of the Charts page.
The plugin self-migrates schema on every activation and on plugins_loaded (compares stored glimpsebi_db_version against the bundled constant).
Screenshots
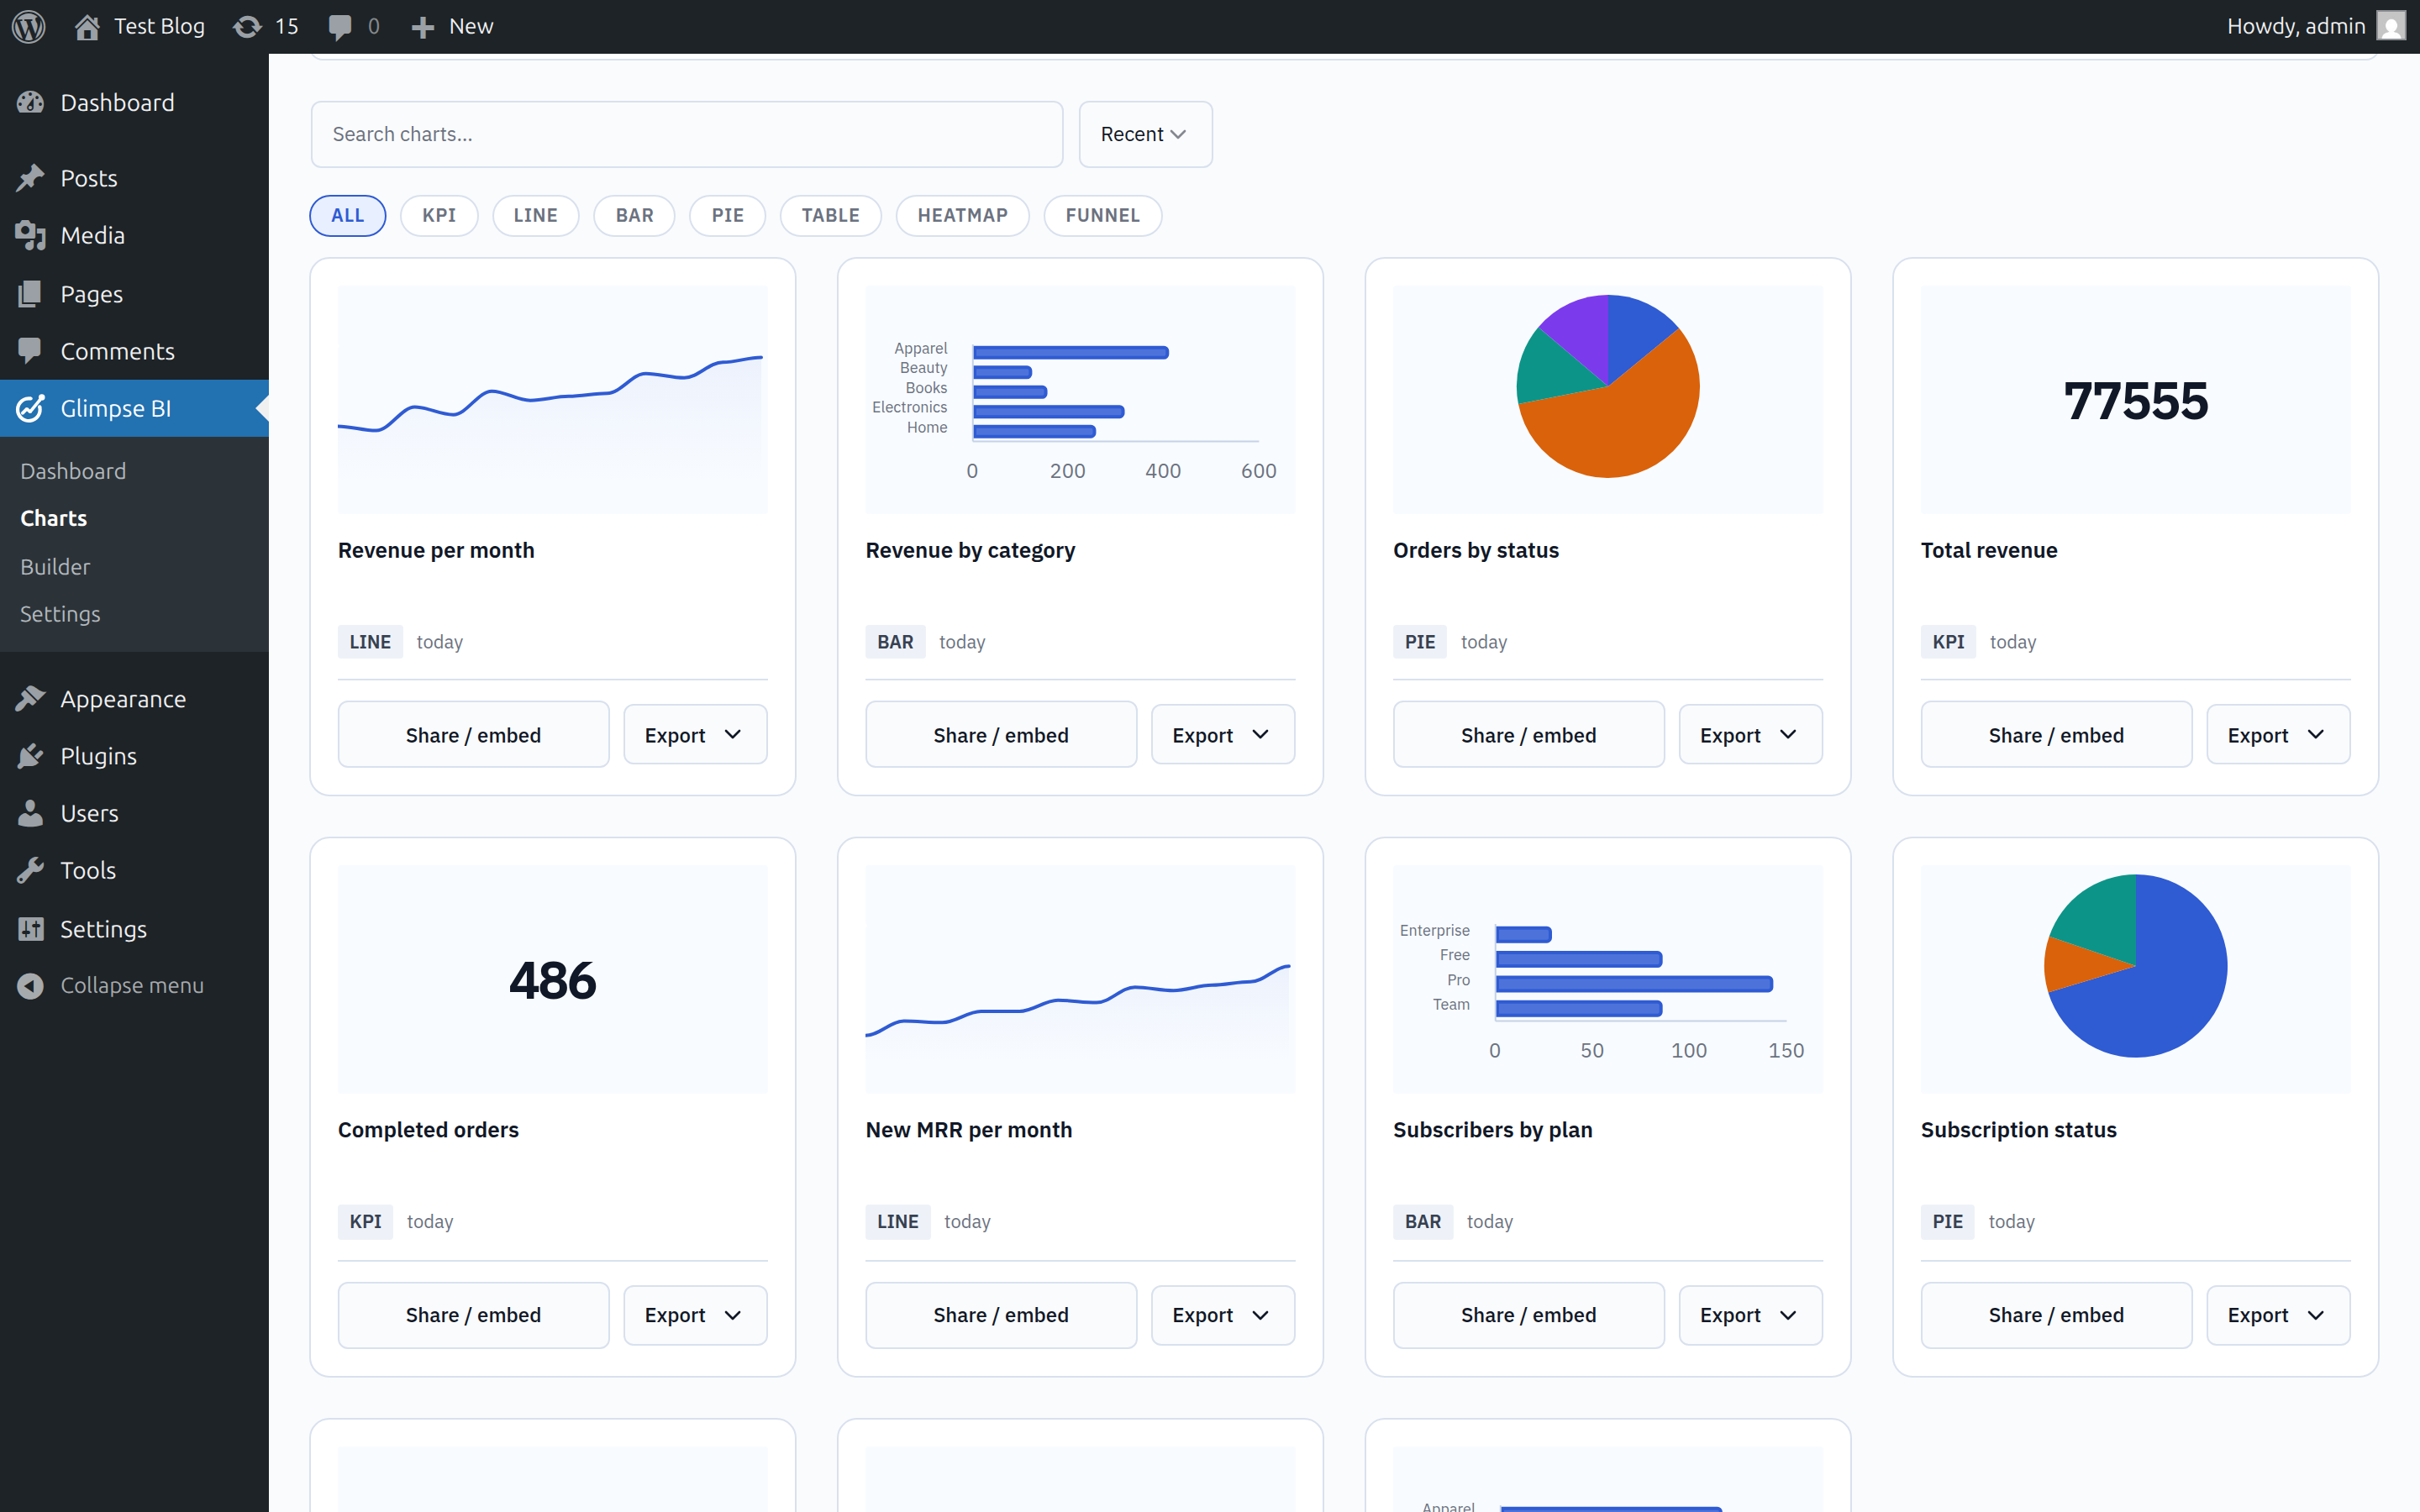
Chart library — browse saved charts with live previews, filter by type, and install a dashboard preset in one click.
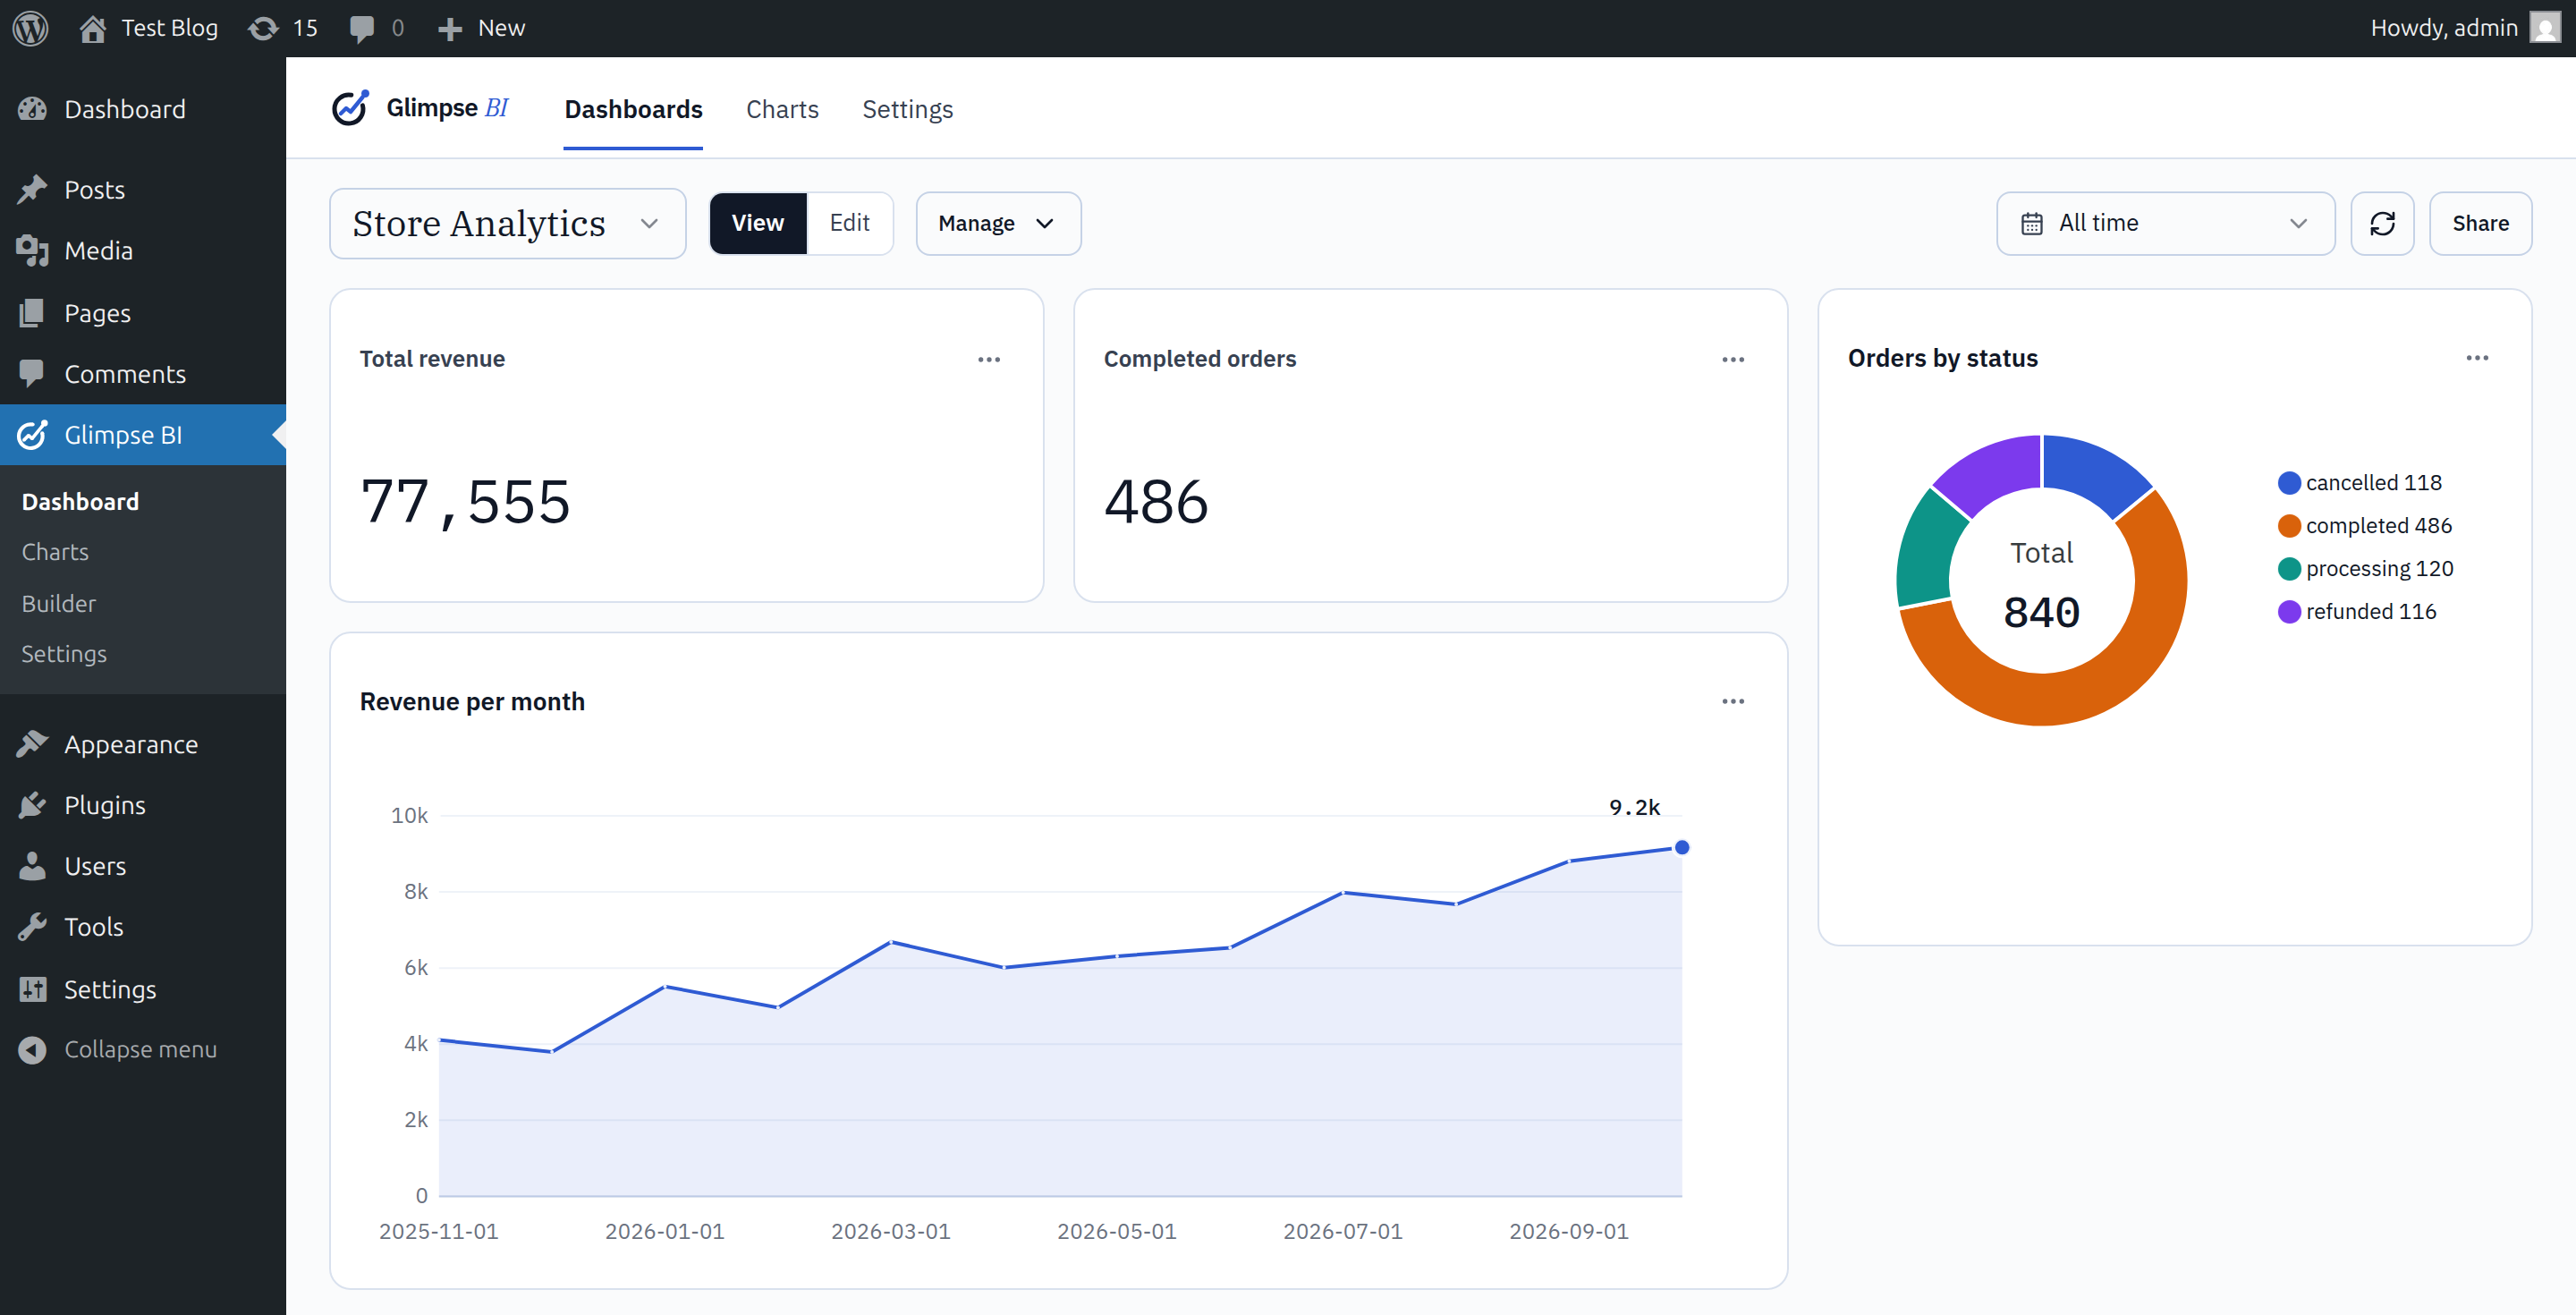
Dashboard — a 12-column grid of KPIs and charts (revenue, orders, average order value, category mix) with a global date-range filter.

Chart builder, GUI mode — pick a table, measure, and dimension to build a chart with a live preview; no SQL required.
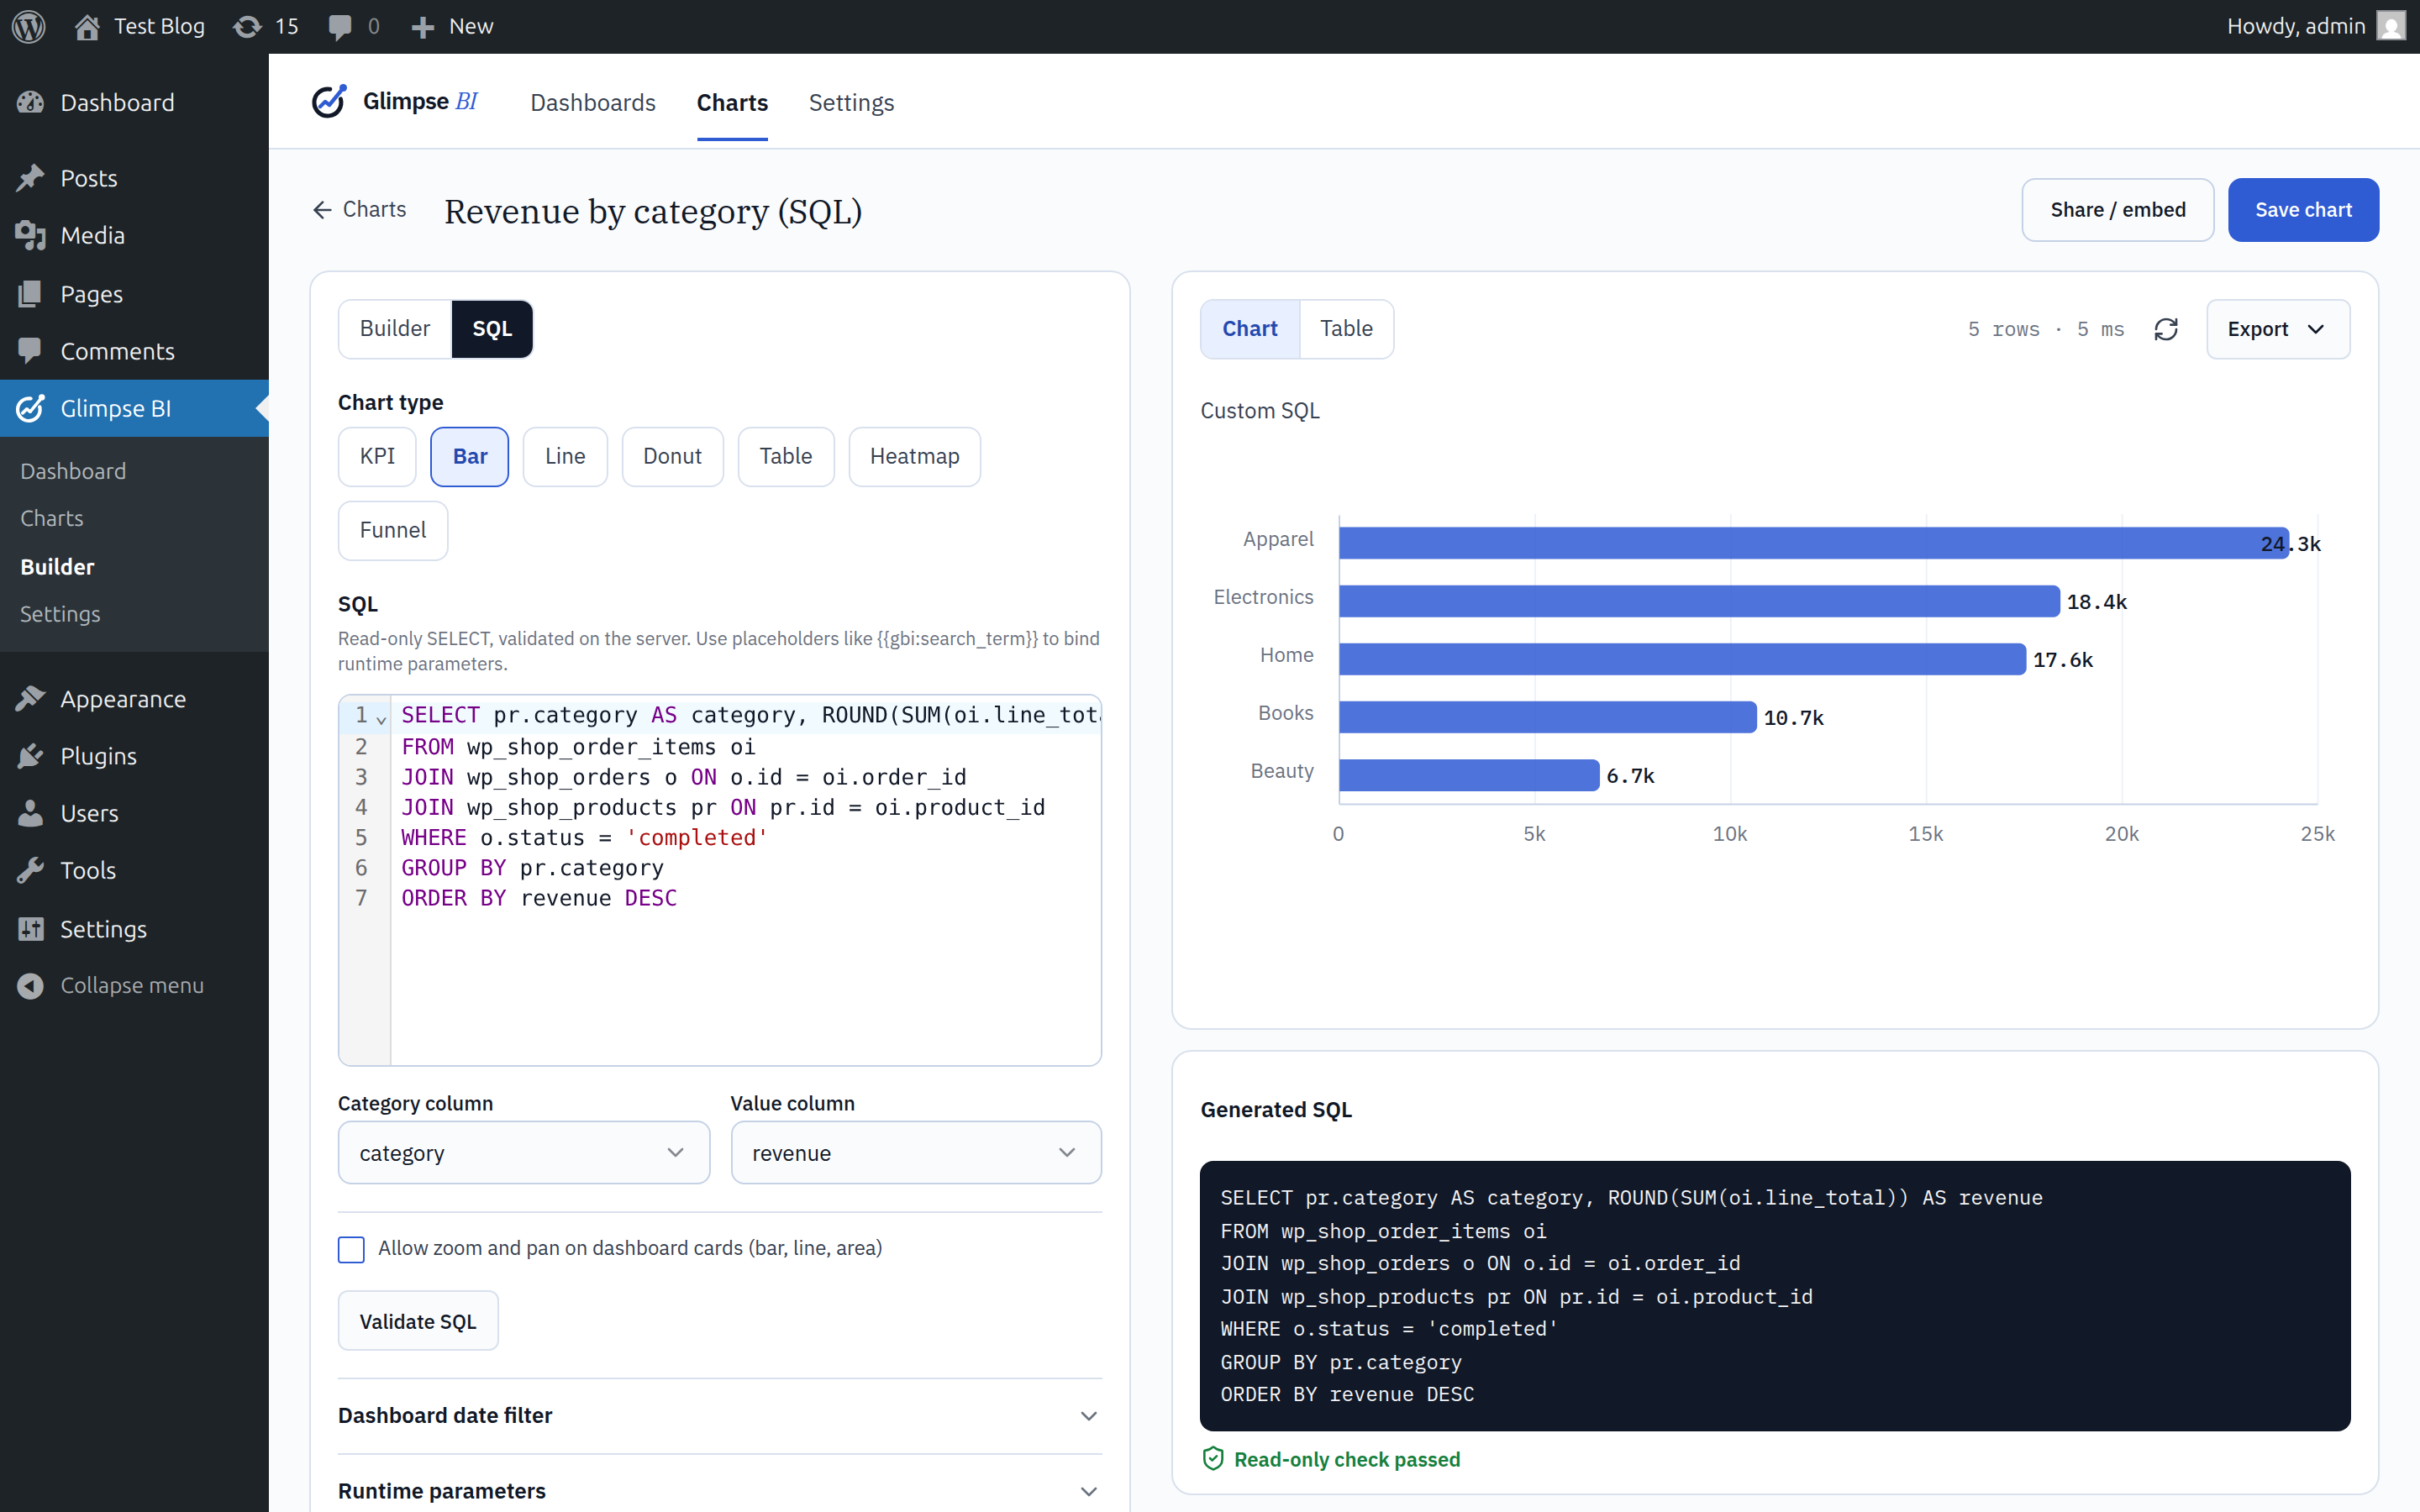
Chart builder, SQL mode — write a read-only query (validated by an AST parser) in a CodeMirror editor with a live preview and column mapping.
Public embed — share a single chart as a token-gated, branded iframe with no wp-admin chrome.

Settings — tune cache TTL, query limits, and schema discovery.
Faq
Only SELECT statements (and WITH ... SELECT CTEs) pass the server-side AST validator. Multi-statement queries, INTO OUTFILE, LOAD_FILE, SLEEP, and (by default) information_schema access are rejected.
Chart results pass through a stale-while-revalidate cache (default TTL: 15 min) keyed by chart + definition + runtime params. A regen lock prevents thundering-herd queries when the cache expires. Schema introspection is cached for 1 hour and refreshed manually from the Settings page.
It ships inside the plugin, in src/. The “Source code and build tools” section of the description explains how each compiled file is built, and links to the source of every bundled library. Run npm ci and then npm run build in the plugin folder to rebuild assets/build/.
Yes. Glimpse BI Pro is a separately distributed add-on with its own implementation code. This WordPress.org plugin is fully functional without a license key.
Reviews
Changelog
1.0.3
- Security: the schema allowlist is now enforced on the server when builder (GUI) charts are previewed and saved, not just hidden in the builder. A builder chart can no longer read a table that Settings hides, such as the users table. Existing saved charts keep rendering. SQL-mode charts, which only administrators can write, are not restricted by the allowlist.
- Fixed: a chart whose query the database rejects (for example a column that no longer exists) now shows an error instead of an empty chart, and the error is never cached.
- Fixed: previewing or saving a chart that references a missing table or column now names the exact field to fix.
- Developer: chart definitions accept Min, Max and Count distinct measures and an optional
order(by value or group) for top-N charts;GlimpseBI_Query::json_schema()andGlimpseBI_Query::describe()expose the definition contract. - Changed: the readme documents where the source of every compiled file lives and how to rebuild it, with links to each bundled library’s source.
1.0.2
- Security: chart labels and series names are now escaped in chart tooltips and legends, so text stored in your data (post titles, customer names) can never run as code in wp-admin or on embeds.
- Security: dashboard exports only include charts the current user is allowed to see.
- Fixed: uninstalling now also removes dashboard presets and the stored schema version.
- Changed: the bundled JavaScript can be rebuilt from the included source with
npm ci && npm run buildfrom the plugin folder.
1.0.1
- Fixed: chart and dashboard exports could download as empty files. Exports now use the dashboard’s selected date range, ignore filters a chart doesn’t use, and show a clear message when a chart still needs filter values instead of silently returning nothing.
- Fixed: exporting a whole dashboard failed with a fatal error.
- Fixed: “New dashboard”, “Duplicate” and embed-token creation could throw a script error.
- New: date ranges Last quarter, Last 6 months, Last 12 months and Last year, plus a custom From/To picker on dashboards. Embedded dashboards offer the longer ranges too.
- Changed: re-installing a preset over an existing one now keeps your existing dashboard and charts (renamed “(previous)”) instead of deleting them.
- Developer: new
glimpsebi_admin_export_formatsfilter lets add-ons offer extra export formats in the Export menus.
1.0.0
- First public release on WordPress.org. Self-serve BI inside wp-admin: a no-code chart builder and validated read-only SQL mode over your existing WordPress tables (WooCommerce, members, bookings, and more), a responsive dashboard grid, public embed iframes with token auth, CSV/JSON exports, dashboard presets, and a stale-while-revalidate cache that keeps it polite to your database. Consolidates all prior 0.x development into a stable 1.0.
0.4.4
- Changed: the chart builder’s Chart-tab preview now shows table charts as a capped 25-row sample (with a “first 25 of N rows” note) instead of the full paginated tile. The builder is for shaping a definition, not browsing the whole result set — the live dashboard tile and public embed still show all rows with pagination/search. No effect on non-table chart types.
0.4.3
- New: dashboard toolbar now has a kebab menu next to the dashboard selector with Rename, Duplicate, and Delete actions.
- New:
POST /dashboards/{id}/duplicateendpoint. Copies the layout and pinned charts (charts are referenced, not cloned — editing a chart still reflects on every dashboard that pins it). New dashboard is named “{Original} (copy)” with an incrementing suffix if needed. - Note: the Home dashboard cannot be deleted (the menu item is disabled with a tooltip explaining why; the server also enforces this).
0.4.2
- Fixed: public embed iframes refused to render on hosts whose nginx/security layer also sets
X-Frame-Options: SAMEORIGIN. We were sending the (invalid, non-spec)X-Frame-Options: ALLOWALL; browsers see the two conflicting values and fall back to deny. Now we remove any prior X-Frame-Options and send the spec-compliantContent-Security-Policy: frame-ancestors *instead, which takes precedence over X-Frame-Options in modern browsers per CSP Level 2.
0.4.1
- Fixed: sticky column headers in table charts now have an opaque background, so scrolling rows no longer bleed through them.
- Fixed: rows-per-page selector now has a visible border, hover state, focus ring, and pointer cursor so it actually looks like a control instead of label text.
0.4.0
- New: every table chart now has proper Prev/Next pagination + a rows-per-page selector (25/50/100/200). Previously, only the first 50 filtered rows were visible regardless of how many the SQL returned. Search now resets to page 1 automatically.
- New (kivicare preset): Encounters KPI + table, sourced from
wp_kc_patient_encounters(the clinical-visits table, distinct from appointments). The dashboard’s Services charts were inadvertently counting service-line-items-on-appointments, not encounters — so visit volume was missing entirely. - Changed (kivicare preset): the Services charts now show the catalog. Total Services = distinct active services in
wp_kc_services. Services table = catalog rows plusTimes PerformedandDistinct Doctorscolumns aggregated fromwp_kc_appointment_service_mappingin the selected date range. One table answers both “what do we offer?” and “what’s getting used?” - Changed: directory-table SQL LIMITs bumped from 200 to 2000 so pagination has room to navigate large clinics.
- Existing kivicare installs: Library -> Presets -> KiviCare -> Install (Replace) to pick up the new charts + layout.
0.3.4
- Fixed: KiviCare preset queries now seed from the
wp_kc_{doctor,patient,receptionist}_clinic_mappingstables instead of scanningwp_usermetaforLIKE '%kiviCare_*%'. The capability LIKE pattern was forcing a full table scan on every chart load — measured 5–6s cold-start with 196 doctors. The rewrite drops that to <1s by seeding from a small indexed table. Existing installs: Library Presets KiviCare Install (Replace) to pick up the new SQL. - Note: an unintended side-effect is that doctors/patients/receptionists who have the WordPress role but aren’t assigned to any clinic disappear from the directory tables. This matches typical “operations dashboard” intent (unassigned = inactive). Open an issue if you need the old behavior back.
0.3.3
- Fixed: dashboards with many tiles no longer storm shared/managed WP hosts with parallel chart-data requests. The client now loads charts in batches of 3 at a time, and transient upstream failures (502/503/504) are retried once with a short backoff. Eliminates the “first few tiles load, the rest 502” failure mode on EasyWP and other tight PHP-FPM pools.
0.3.2
- Fixed: write requests now succeed on shared/managed WP hosts whose WAFs reject both PATCH/DELETE verbs and the
X-HTTP-Method-Overrideheader (Imunify360 on EasyWP, observed in the wild). Every PATCH route now also accepts plain POST on the same URL; every DELETE route has a parallelPOST {path}/deletealias. The client sends plain POST with no special headers — invisible to WAFs that pattern-match suspicious patterns.
0.3.1
- Attempted fix using
X-HTTP-Method-Override. Worked locally but the header itself is WAF-flagged on some hosts. Superseded by 0.3.2 — please upgrade directly to 0.3.2.
0.3.0
- New: dashboard presets registry — install ready-made dashboards in one click, including a KiviCare clinic-operations preset.
- New: per-dashboard date-range global filter that auto-injects into SQL charts declaring
date_from/date_toparameters. - New: embed iframes now expose a date-range picker and per-chart CSV / JSON download links.
- Fixed: chart builder no longer crashes when loading preset-installed SQL charts (made
column_mappingoptional). - Fixed: REST preview returns 400 (was 500) for missing required runtime parameters.
0.2.0
- Earlier release; see commit history for details.