MaxiCharts

MaxiCharts
Description
Create beautiful Chartsjs charts from Gravity Forms submission data or CSV data with a simple shortcode.
Use all your past data to visualize advanced statistics in a few clics. You NEED to install at least one add-on in order to use shortcodes.
Requires Gravity Forms v2.3+
All code has been moved to GitHub now : MaxiCharts on Github
Add-ons
You NEED to install at least one of them:
- Maxicharts Gravity Forms source add-on : chart all Gravity Forms submission data
- MaxiCharts CSV add-on : in order to graph CSV files
Optional add-ons:
- MaxiCharts Gravity View add-on : in order to filter entries on Gravity View “approved” ones
- MaxiCharts Query Builder add-on : Real time filter entries on graph using Query Builder
- MaxiCharts Extended Colors add-on “Extended Colors”) : Extended colors sets
Usage
Use the post visual editor brand new button to add as many shortcodes as you want in a few clics !
You need to install the core MaxiCharts plugin in any case, then if you use, for example Gravity Forms add-on, the shortcode processed is:
[gfchartsreports gf_form_id="form_id" include="fieldNb1,fieldNb2,fieldNb3,.." exclude="fieldNb4,fieldNb5,..." color_set="set" type="graphType" width="width(px|%)" float="true|false" chart_js_options="options"]
where all parameters are optional:
- gf_form_id : expects the form ID in Gravity Forms (defaults to first form : id=1)
- type : is the type of graph, at the moment only line,pie,doughnut,bar,horizontalBar available (defaults to pie)
- include : expects the field ids to include (example :
include="1,3,4") - exclude : expects the field ids to exlude (example :
exclude="2,4,6")
see all parameters on demonstration site
Examples
Display all fields of form #1 as pie charts with custom chartjs options for titles:
[gfchartsreports chart_js_options="title: {display: true, text: 'My Funky Chart Title', fontSize:28,fontFamily:'Arial',fontColor:'#00B88A',fontStyle:'bold',padding:20}"]
Displays fields 4, 7 and 18 of gravity form #3 with bar charts. Default colors used.
[gfchartsreports gf_form_id="3" include="4,7,18" type="bar"]
Displays field 2 of gravity form #2 with default pie chart. Use red color set, with not randomization.
[gfchartsreports gf_form_id="2" include="2" color_set="red"]
Displays all but fields 4,7,18 of gravity form #8 with horizontalBar type charts. Use blue color set, randomized.
[gfchartsreports gf_form_id="8" exclude="4,7,18" color_set="blue" color_rand="true" type="horizontalBar"]
More examples here : >> Demonstration site <<
Installation
Easy
- Search via plugins > add new.
- Find the plugin listed and click activate.
- Use the Shortcode
Screenshots
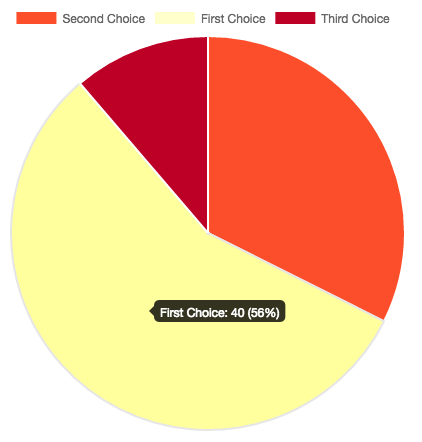
Chart report example 1

Chart report example 2

Chart report example 3


Reviews
Not work
By ssobolevski on June 23, 2021
Beste charting option for gravity forms
By keesjan on January 22, 2020
Amazing Charts. I LOVE THEM
By luciche on June 5, 2019
Powerful plugin and easy to set up
By (adput) on September 28, 2018
Plugin flessibile e supporto istantaneo
By dizplay on July 17, 2018
Awesome plugin and great service
By Pierre Helium (pierrethenot) on June 14, 2018
Wonderful integration of the great Chart.js library with tons of flexibility
By KZeni on May 7, 2018
Great!
By maxicharts on October 20, 2017
Great chart hub
By termel (munger41) on July 17, 2017
Changelog
-
1.7.6 – php warning fixed
-
1.7.5 – log level as a parameter
-
1.7.4 – new maximum_fraction_digits parameter
-
1.7.3 – js rounding issue fixed
-
1.7.2 – information_source bug fix
-
1.7.1 – more parameters on datalabels
-
1.7.0 – introducing datalabels
-
1.6.7 – log level back to normal (warn)
-
1.6.6 – reduce space before : in tooltips
-
1.6.5 – no_entries_custom_message bug fixed
-
1.6.4 – automatic std dev annotation
-
1.6.3 – automatic mean for numeric datasets added
-
1.6.2 – box annotation added
-
1.6.1 – previous options fixed
-
1.6.0 – charjs upgraded to 2.9.3 / annotation plugin added
-
1.5.2 – better labels cleaning
-
1.5.1 – filter parameter fix
-
1.5.0 – new singleton structure
-
1.4.12 – bug fix on gf_entry_id
-
1.4.11 – bug on line charts
-
1.4.10 – bug on array access : https://wordpress.org/support/topic/php-warning-error-7/#post-11700240
-
1.4.9 – bug fix for : https://wordpress.org/support/topic/php-warning-error-7/
-
1.4.6 – more error msg feedback
-
1.4.5 – date_end filter added : accepts any strtotime input
-
1.4.4 – date_start filter added : accepts any strtotime input
-
1.4.3 – half doughnuts and pies
-
1.4.2 – radar charts with alpha backgrounds
-
1.4.1 – CSV patch added : https://wordpress.org/support/topic/proposed-bugfix-csv-source-always-assumes-multiset-of-data-even-when-untrue/
-
1.4.0 – Radar charts enhancements
-
1.3.4 – betsy bug
-
1.3.3 – bug fix on field filters, and log level set to info
-
1.3.2 – radar tests
-
1.3.1 – randomize color sets upon new ones
-
1.3 – color management upgraded for new add-on
-
1.2.5 – boolval bug fix for PHP < 5.5
-
1.2.4 – data conversion now converts to locale (solves , or . problems)
-
1.2.3 – table round precision set to 0 (parameter in next versions)
-
1.2.2 – multiple custom criteria (query builder and user custom) managed
-
1.2.1 – adjustments on number formats for UK clients
-
1.2 – tiny mce editor button gf forms pre-load fixed
-
1.1.4 – tick size fixed
-
1.1.3 – stepSize: 1
-
1.1.2 – back to only int fields
-
1.1.1 – new mode parameter compatibility
-
1.1 – query builder compatibility
-
1.0.9 – bug on button editor boolean values fixed
-
1.0.8 – only_data internal parameter added in order to manage query builder add-on
-
1.0.7 – multisite management for button in editor
-
1.0.6 – bug on tooltips
-
1.0.5 – warning fixed : https://wordpress.org/support/topic/warning-missing-argument-1-3/
-
1.0.4 – tinymce still bugs
-
1.0.3 – random
-
1.0.2 – tinymce bug fixed
-
1.0.1 – logger issues fixed
-
1.0 – First stable release.