SQL Chart Builder
SQL Chart Builder
Description
The plugin creates beautiful charts based on your SQL queries, then you can use those charts in any part of your website.
You can use both native wp and non-wp mysql tables in your queries.
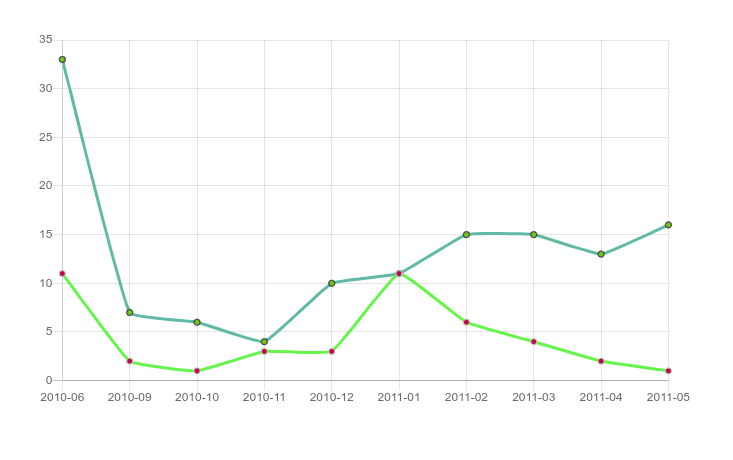
11 chart types: Pie, Doughnut, Polar Area, Radar, Line, Area, Stepped Line, Bar, Horizontal Bar, Stacked Bar, Scatter
What’s new in 3.0
- A completely redesigned chart builder. No more “nerd-only” settings page: a clean, tabbed UI walks you through Chart & Data Dynamic Filters Style Advanced.
- Visual chart type picker with built-in guides. Every chart type shows a short “when to use it” guide plus a working example query you can insert with one click.
- Live SQL autocomplete. Start typing and the editor suggests SQL keywords (type “S” — get SELECT), your real database table names and real column names. Type
tablename.to see that table’s columns. Press Ctrl+Space for suggestions at any time. - Click-to-build query toolbar. SELECT / COUNT(*) / FROM / WHERE / GROUP BY / ORDER BY / LIMIT buttons plus “Insert table”, “Insert column” and “Insert dynamic tag” dropdowns filled with your actual database schema — build a best-practice query without typing a single word.
- No-code input filters. Add date/number/text filters as simple rows (tag, type, label, default) — the tag dropdown suggests
{tags}already used in your query and columns from its WHERE part. No more memorizing the~/|syntax (a raw editor is still available for pros). One click inserts the{tag}into your query. - Dropdown column mapping. The X/Y axis fields are dropdowns filled with the columns detected in your SQL query — no more guessing column names.
- Color pickers instead of typing hex codes, and a fixed professional default palette instead of random colors.
- Latest Chart.js v4, bundled inside the plugin — no third-party CDN calls, GDPR-friendly.
- 4 new chart types: Radar, Stepped Line, Stacked Bar and Scatter.
- Better front-end design: modern table view, restyled filter form and datepicker.
- Full legacy support: charts created with 2.x keep working unchanged. Deprecated Google-Chart types are automatically mapped to modern equivalents when you open/save the chart.
How to use
-
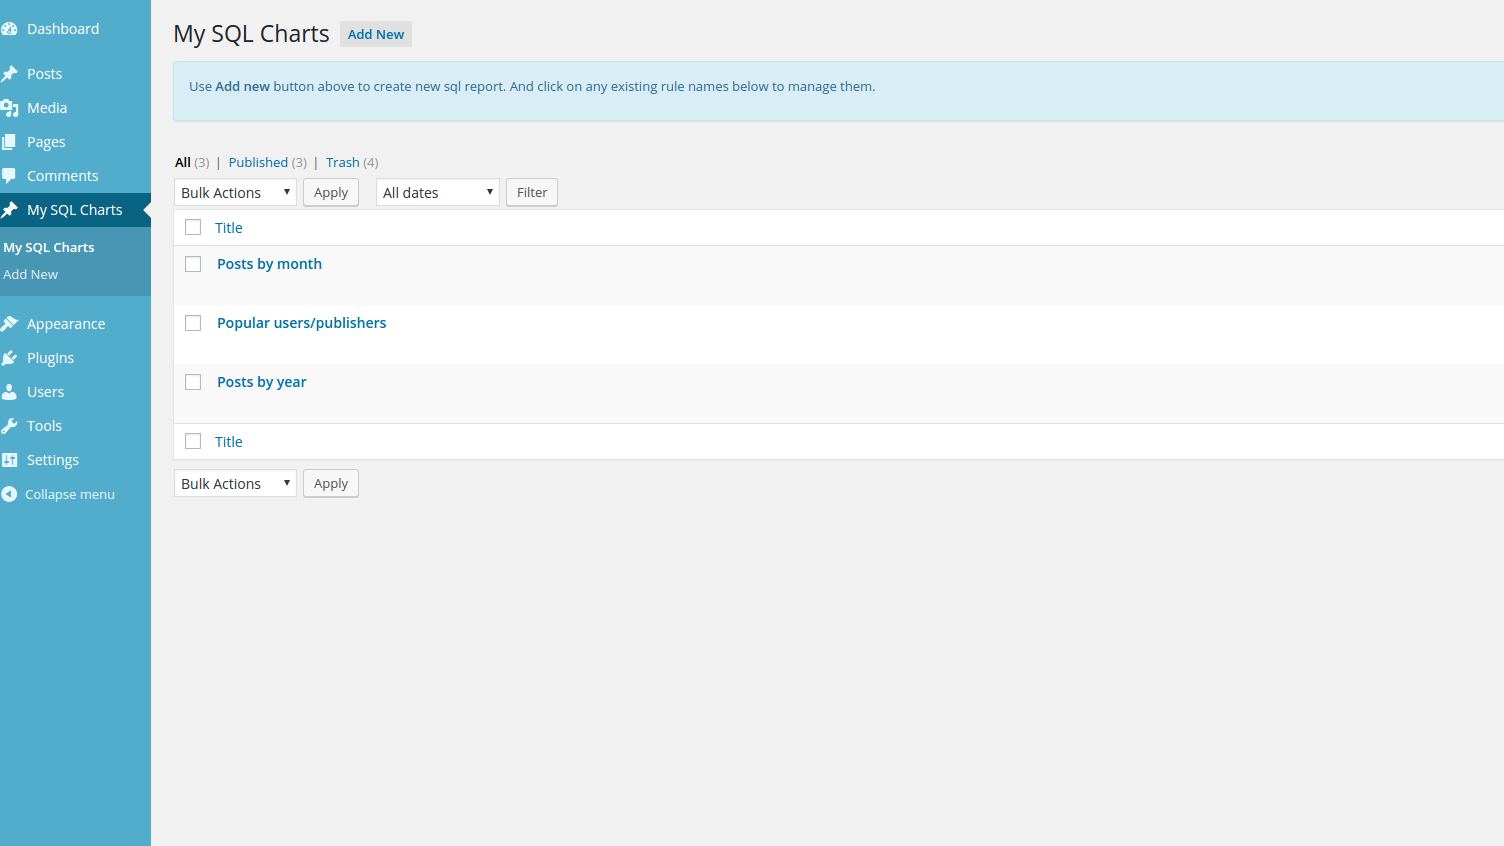
Go to Dashboard My SQL Charts Add New and give any name to your report.
-
Pick a chart type — read the short guide shown under the type cards, or click “Use this example” to start from a working query.
-
Build your SQL query with the toolbar buttons and autocomplete (real table and column names are suggested), then map the X and Y columns.
-
You can use multiple SQL queries too — just split them with the “;” sign to get comparison charts. You can also pass shortcode arguments into the query: with “select * from wp_posts where ID>{arg1}” the shortcode [gvn_schart_2 id=”2″ arg1=”11″] passes the value in (the builder’s live preview runs without arguments, so test such charts on a page).
-
After Publish/Update you will see the shortcode below the builder. Use it anywhere on your website: pages, posts, widgets, or the “My SQL Charts” Gutenberg block.
-
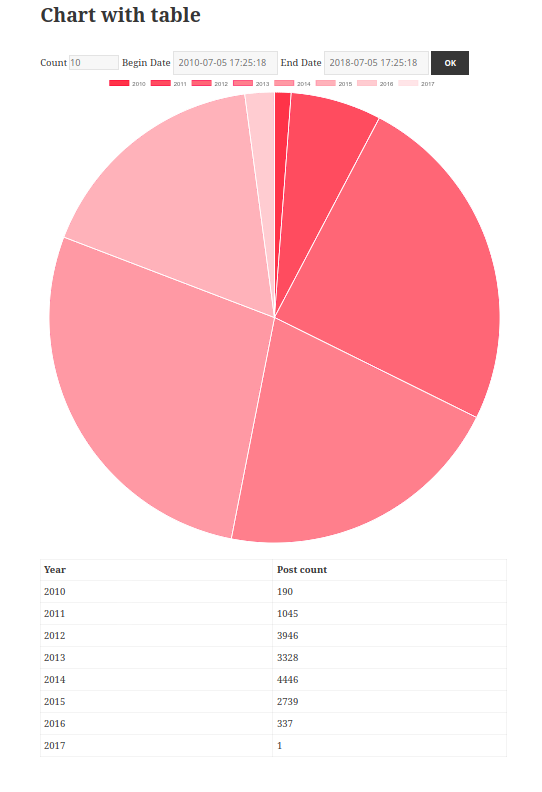
Check “Show table-view data below the graph” to also render the data as a styled table.
-
In the Input Filters tab, add filters by clicking “+ Add filter” — each one becomes an input (with a datepicker for date types) above the chart at the front-end.
Chart type mini-guide
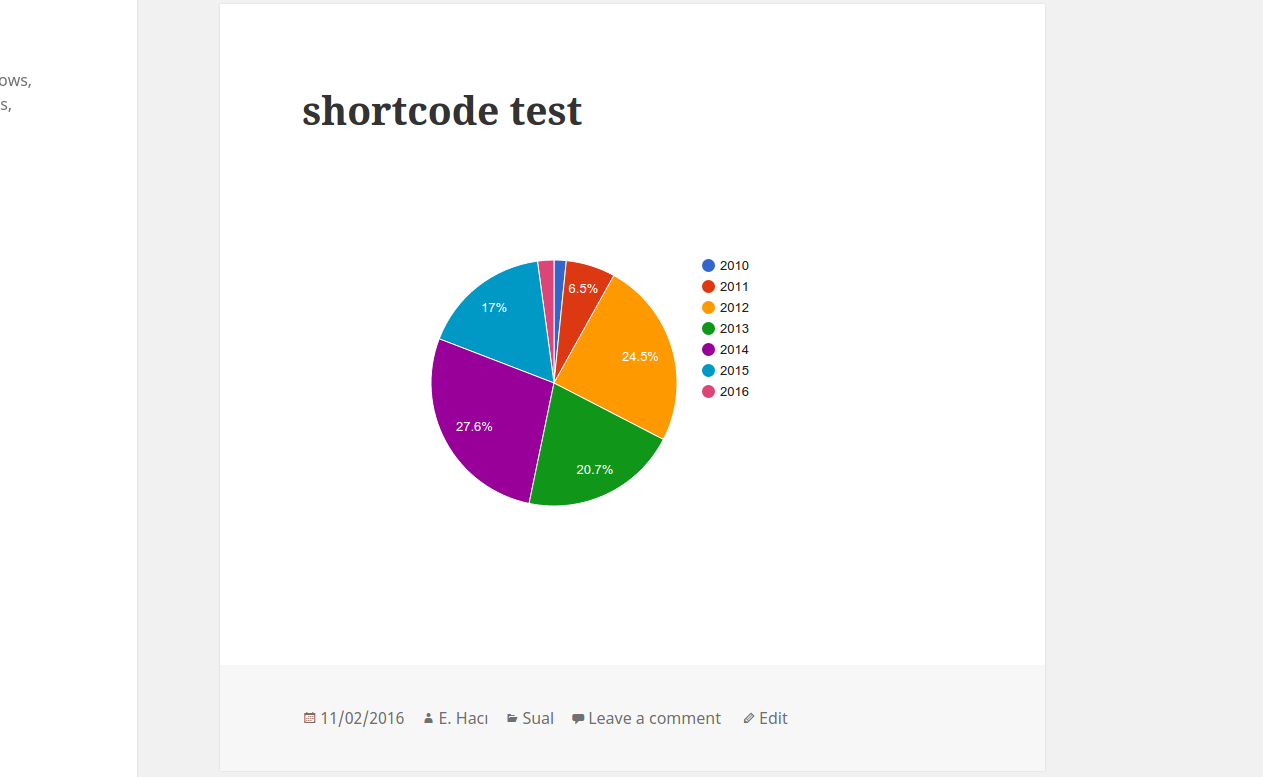
- Pie / Doughnut — how a total splits into a few parts. One query: label column + numeric column.
- Polar Area — like a pie, but the value controls the radius; great for cyclic data (months, weekdays).
- Radar — compare one or more series across categories arranged in a circle (profiles, ratings).
- Line — trends over time; add more “;”-separated queries for comparison lines.
- Area — a line with the region filled; emphasizes volume.
- Stepped Line — values that change at discrete moments (prices, stock levels).
- Bar / Horizontal Bar — compare categories; horizontal is best for long labels.
- Stacked Bar — how each category total is composed; each “;”-separated query becomes one segment.
- Scatter — correlation between two numeric columns (both X and Y must be numeric).
Input filters (dynamic variables)
Use the visual rows in the Input Filters tab, or the raw format:
variable_name~default_value~variable_label~variable_type | variable_name~default_value~variable_label~variable_type
- variable_name – any single name you want.
- default_value – default value when no variable is chosen by the user
- variable_label – label visible on the form above the chart
- variable_type – number, text or date
- ~ separates variable elements, | separates variables
Example: with the filters “limit_tag~10~Count~number | post_date_tag~2010-07-05~Date Published~date”
you can use “select * from wp_posts where post_date<{post_date_tag} limit {limit_tag}” as the SQL code —
the plugin renders the corresponding inputs above the chart automatically.
Supported built-in dynamic tags: {current_user_id}, {current_user_login}, {current_user_email}, {current_user_display_name}.
Caching
Use [gvn_schart_2_cached id=”1″ expire=”3600″] to cache the rendered chart in a transient. Add &force_sql_cache_reload=1 to the URL to bypass it once (e.g. right after upgrading).
Website
https://guaven.com/my-sql-charts/
Documentation
https://guaven.com/my-sql-charts/#docs
Bug Submission and Forum Support
Please Vote if you liked our plugin
Your votes really help us. Thanks.
Available Filters
apply_filters( ‘guaven_sqlcharts_table_empty_cell’);
apply_filters(‘guaven_sqlcharts_pre_print_vars’);
apply_filters( ‘guaven_sqlcharts_final_output’);
apply_filters(‘guaven_sqlcharts_rendered_sql’);
Installation
- Upload ‘guaven_sqlcharts.zip’ to the ‘/wp-content/plugins/’ directory
- Unzip it.
- Go to Dashboard/Plugins and Activate the plugin.
- Go to “Dashboard/My SQL Charts” to create new charts. Guides are built into the chart builder.
Screenshots
Screenshot 1
Screenshot 2

Screenshot 3
Screenshot 4

Screenshot 5
Faq
Yes. 3.0 reads exactly the same settings as 2.x, so every existing chart and shortcode keeps working. Charts using the long-deprecated Google Chart types are automatically mapped to the equivalent modern chart types. If you use the cached shortcode, add &force_sql_cache_reload=1 to the URL once after upgrading to refresh the cache.
No. Chart.js v4 and all other assets ship inside the plugin.
No, chart management requires the manage_options capability, and only SELECT queries are allowed.
Reviews
Excellent
By 
Great lightweight plugin for visualizations
By 
Great free plugin with very fast support when needed, good performance, lightweight. Absolutely recommended.
My favorite for real time visualizations of information from wordpress database. I use it instead of embedding Google Looker Studio reports.
Be careful, wait for update
By 
Current version of SQL Chart Builder not compatible with PHP 8 and WP 6.1.1. It will block your website immediately after installing.
Highly recommended chart plugin
By 
how to show values directly on a bar chart
By 
Very easy to create charts directly from DB
By 
mySql connectivity
By 
Can't handle UTF-8 Characters
By 
Best SQL chart plugins
By 
I had such high hopes 🙁
By 
Changelog
3.0.5
- FIX: Date/time X axis on Bar charts: bars now have a fixed, clearly visible width instead of shrinking to the closest pair of dates.
- FIX: Date/time X axis: the axis now labels only the dates present in the data instead of evenly spaced computed dates.
3.0.4
- SECURITY: Chart posts are now administrator-only at the capability level (all gvn_schart capabilities map to manage_options), so Contributors/Authors can no longer create or edit charts through any WordPress entry point such as XML-RPC. All guaven_sqlcharts_* custom fields are protected meta.
- SECURITY: The forbidden-command check now runs on the final SQL after all shortcode arguments and filter values are inserted, “;” is stripped from user-supplied values, and every statement must start with SELECT, WITH, SHOW, DESCRIBE or EXPLAIN. PREPARE/EXECUTE, LOCK, KILL, FLUSH and similar statements were added to the blocked list.
- SECURITY: The cached shortcode now keeps a separate cache entry per user and per dynamic filter value, so a chart using {current_user_*} tags or URL filters can no longer serve one visitor’s result to another.
- SECURITY: The shortcode “params” attribute is validated and can no longer inject JavaScript into the chart script.
- The chart save handler now also requires manage_options and the gvn_schart post type.
3.0.3
- FIX: Using the same shortcode argument tag (e.g. {arg1}) more than once in the SQL, such as in both queries of a comparison chart, broke the chart with a fatal error.
- FIX: The [gvn_schart_2_cached] shortcode ignored arg1..arg19, width, height, table and params attributes; they are now passed through and each set of attributes is cached separately.
- IMPROVED: When the SQL contains {arg} tags, the builder shows the shortcode with the needed attributes and explains that the live preview runs without them.
- NEW: “Scale X axis by date/time” option (Advanced tab) for Bar and Line charts. Points and bars are placed by real elapsed time when the X values are dates (2024-02-23, 2024-02, 2024, 2024-02-23 14:30). Off by default; existing charts are unchanged.
3.0.2
- FIX: “Value labels” option now works for Bar, Horizontal Bar, Stacked Bar, Line, Area, Stepped Line, Radar and Scatter charts (previously only circular charts).
- NEW: The X axis label and Y axis label fields are now shown as real axis titles on Bar, Line and Scatter charts (Y title for single-series charts; multi-series charts keep the names in the legend).
- FIX: Series names containing “&” were cut off (the stored & entity was mistaken for a “;” series separator); labels with quotes or other special characters no longer show HTML entities in the legend or table view.
- IMPROVED: Clearer hints in the chart builder for the label, color and value-label fields.
3.0.1
- FIX: SQL query editor showed HTML entities (e.g. ") instead of quotes after saving a chart. Queries are now stored exactly as typed; single quotes are no longer converted to double quotes. Charts saved with older versions are decoded automatically.
- Tested up to WordPress 7.1.2.
= 3.0.0=
* NEW: Completely redesigned admin chart builder — tabbed UI (Chart & Data / Dynamic Filters / Style / Advanced) with visual chart-type cards.
* NEW: Live SQL autocomplete — suggests SQL keywords, real table names and real column names from your database while you type (Ctrl+Space to trigger manually).
* NEW: Click-to-build query toolbar — SELECT/FROM/WHERE/GROUP BY/ORDER BY/LIMIT buttons + insert-table/insert-column/insert-tag dropdowns based on the live DB schema.
* NEW: No-code Input Filters builder — add filters as visual rows; tag names are suggested from your query, and {tags} are inserted with one click (raw format still supported).
* NEW: X/Y column mapping via dropdowns auto-filled from the columns detected in your SQL query.
* NEW: Fixed professional default color palette (Tableau 10) replaces random colors; override via the guaven_sqlcharts_default_palette filter.
* IMPROVED: Proper “Chart” admin labels and menu icon for the chart post type (no more generic “Post” wording).
* NEW: Built-in per-chart-type usage guides with one-click example queries.
* NEW: 4 chart types added — Radar, Stepped Line, Stacked Bar, Scatter (11 types total).
* NEW: Color pickers for chart colors.
* IMPROVED: Upgraded to the latest Chart.js v4, bundled locally in the plugin (no third-party URLs).
* IMPROVED: Modern front-end styling for the table view, dynamic filter form and datepicker.
* IMPROVED: Shortcode width/height attributes now work as documented; charts are responsive by default.
* IMPROVED: Forbidden-SQL check is now case-insensitive with word-boundary matching.
* LEGACY: Old 2.x charts work unchanged; deprecated Google-Chart types auto-migrate to modern equivalents on edit/save; the [gvn_schart] legacy shortcode is now served by the modern renderer.
* REMOVED: Google Charts options (deprecated since 2.x) and leftover internal debug code.
= 2.3.8=
* Security fix: Patched SQL injection vulnerability in Dynamic Filter Variables feature. User-supplied GET parameters are now properly sanitized using sanitize_text_field() and esc_sql(), and the () bypass loophole has been removed for user input. Credits: WPScan team for responsible disclosure.
= 2.3.7=
* Fixed small security issue
* More escape/sanitize related security improvements
= 2.3.5=
- 2 bug fixes on chart rendering X axis values
= 2.3.4=
- Backend improvements on existing features
= 2.3.3=
- Fixed: PHP warning issue
= 2.3.2=
- Added: Enable/disable Stackedness of bar charts
= 2.3.1=
- Added: Enable/disable Legend section in Charts
= 2.3.0=
-
Added: One new chart – Polar Area
-
Added: New small feature – Round Y Axis tick values
-
Improvement: Hashing DB Remote password
= 2.2.2=
-
Added: Custom color support for PIE charts
-
Added: Insert custom chart parameters via Shortcode attributes
= 2.2.1=
- Small improvements
= 2.2.0=
-
Added width-height support
-
Added “Zero point” to line chart
-
Bugfixes
= 2.1.2=
-
New feature: Remote Database Connection
-
Setting custom & fixed colors for charts
-
Small improvement in table-view component
= 2.1.1=
-
Fixed small bug in Area Charts
-
Chart library has been updated to the latest version
= 2.1.0=
-
Dynamic filters added: You can use dynamic date/number/text filters at frontend.
-
Table-view support added.
= 2.0.4=
Now you can add custom arguments to the SQL query.
= 2.0.0=
-
New non-Google Local Charts added.
-
Use multiple mysql queries in one graph.
= 1.0.0=
- Uploaded to WordPress.org
= 1.0.2=
- Little fixes
= 1.0.5=
-
Added WP 4.7 compatibility
-
Fixed “multiple charts in one page” issue.